Has there been a week in 2017 where you didn’t read, or at least scrolled by, an article on blockchain or Bitcoin and its various potentials for the future? Chances are, you will come across an article today after finishing reading this one.
In its short history the Bitcoin economy has undergone various shifts, in fact, as Tasca, Liu, Hayes analyze in their paper published in June 2016, the Bitcoin economy traversed through three distinct phases, growing from 1,0000 daily transactions in 2011 to 300,000 in 2016. Before delving deeper into their analysis we’d like to advise our readers that for an in-depth look about the de-anonymizations method used, there is no way around actually reading the paper here as this article will focus on the results of the de-anonymization.
But here’s the gist of it: Mapping Bitcoin addresses to identifiable IP addresses as done previously is greatly limited through the easy usage of proxy services, thus the authors have used a cluster method in, which Bitcoin addresses are grouped together if they can be linked to the same entity using the “input address heuristic”. After clustering they have then been labeled into the following categories: exchange, mining pool, online gambling, black market. The analysis thus builds on the Bitcoin network’s pseudonimity, as Nakamoto recognized when writing “[s]ome linking is still unavoidable with multi-input transactions, which necessarily reveal that their inputs were owned by the same owner. The risk is that if the owner of a key is revealed, linking could reveal other transactions that belonged to the same owner”. (Tasca, Liu, Hayes p.4)
So what does the study, using data from January 2009 to May 2015, actually reveal about the Bitcoin economy, its users and patterns?
Unsurprisingly the average volume of transaction differs substantially between each business category, transactions from/to traders to/from exchanges in 20 BTC, while from/to gamblers to/ from gambling services is 0.5 BTC, and from/ to user-dealers to/from black market services is 3 BTC. In addition the study reveals that all users and entities tend to use rounds numbers. Gamblers place bets using 0.1, 0.2. 1.0 BTC in high frequency, similarly as they would do in casino’s, argue Tasca, Liu, and Hayes.
Traders similarly tend to wait until they accumulated an even amount, most commonly 1.0 BTC before selling them at exchanges, just like black market sellers and miners tend to use round amounts. Miners, interestingly most commonly sell their rewards on a daily basis, which could indicate, argue the authors that they “are operating for-profit and are not doing so
in order to accumulate and hoard bitcoins”.
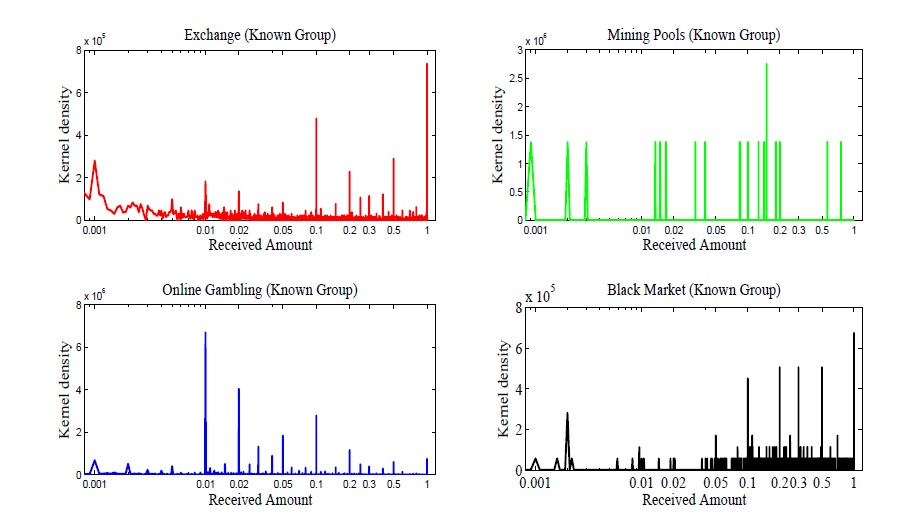
Bitcoin inflows for each business category (Tasca, Liu, Hayes p.23)
The authors then continue by analyzing the evolution and shifts among usage for each business category and find three phases that occurred in the Bitcoin economy.
From January 2009 to March 2012 the “proof-of-concept” period was dominated by miners with very little commercial activity. This period was followed by the “early adopter” phase, or as some might call it “the period of sin” from April 2012 until October 2013. According to the authors’ data “…51% of all transaction inflows on the Bitcoin blockchain” came from gambling and black market businesses. The unique features of Bitcoin, such as its “relative anonymity, lack of regulatory and legal oversight, and borderless transactions… absent from taxation” attracted these types of businesses first. While the Silk Road, the largest black market at the time, raid and shutdown occurred in October 2013, coinciding with the end of “the period of sin”, the authors argue that this event only partially explains the shift because while the “…relative amount of gambling has declined, the absolute amount wagered in dollar terms has risen…”. Instead, Tasca, Liu, and Hayes argue that the increase in value of one Bitcoin significantly affected the drop in gambling as a percentage of overall bitcoin transactions.
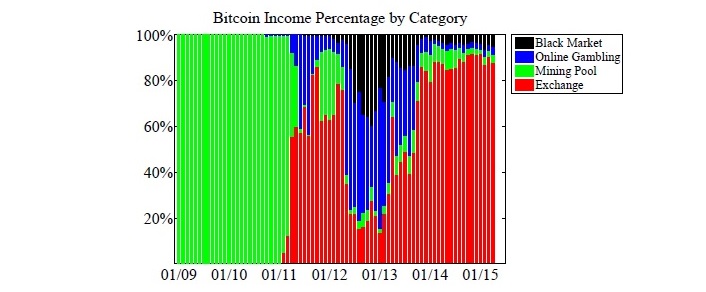
Tasca, Liu, Hayes p.35
The third period, in which we currently live, started in November 2013 and is characterized by the maturing of the Bitcoin economy by diversifying into legitimate payments, commerce, and services. This is furthermore supported by looking at VC investments into the Bitcoin space, which has risen from $2 million in 2012 to $95 million in 2013, followed by $361.5 million in 2014, and more than $500 million in 2015.
While the authors acknowledge that more research is needed in regards to the Bitcoin economy, they argue that their results are of interest to not only Bitcoin enthusiast but also finance professionals, and social scientists as well as regulators and policy makers as their results suggest that “…recent concerns regarding the use of bitcoin for illegal transactions at the present time might be overstated,…”.
The post The Evolution of the Bitcoin Economy and Analyzing the Network of Payment Relationships appeared first on Fintech Schweiz Digital Finance News - FintechNewsCH.
Comments